Like other markets, in the Bitcoin market, we have signals, pulses, and many control tools to predict market behavior in short or long periods. These tools help us take the best possible position. One of these tools is the RHODL indicator, which investigates when Bitcoins are deposited in wallets without transferring from one wallet to another.
The RHODL indicator holds some actual variants in the market, such as terms and a new definition in this market, which we call “age” hereunder, to help traders take the best action at the best time. This indicator achieves the result by analyzing various factors;
The Realized Value HODL Waves which achieved by investigating two different values:
- Short Term, Which is the product of calculating the time coins moved from one wallet to another in a short time frame (e.g., the past week).
- Long Term, This Realized Value HODL Waves formed the calculation of the coins that last moved in the past (on a more extended time frame range, for example, one or two years.
Still, please remember that this indicator helps but doesn’t guarantee
What is the RHODL indicator, and why is it necessary to check them?
What exactly is the RHODL indicator?
It is Introduces unchain index value of held coins.
How to track the movement of bitcoins at different time intervals? Are there any indicators to compare the value of the HOLD coins in the short or long term?
The RHODL Indicator is an appropriate indicator for investigating the bitcoin market and its movements. The following article will discuss the RHODL indicator and how the mechanisms of calculation of the RHODL indicator. What is the RHODL indicator?
The RHODL stands for Realized HODL. In General, this indicator assists us in comparing the cost of the HOLD* bitcoins at different time intervals.
What is RHODL, also known as Realized HODL Ratio Indicator (HODLRI)?
Once in the early 2010s, a trader mistakenly used “HODL” instead of “HOLD” because of a typing mistake. Since then, “HODL” has become a trend in the crypto market.
HODL defines how long traders keep their digital assets or UTXOs (unspent transaction outputs) stored in the wallet in their crypto wallets. It helps us to realize and also determines the Value of UTXOs. The realized Value is a term that indicates the price of bitcoins at the time of the last transaction/transfer. Imagine if a user decides to transfer 1 $BTC from one wallet to another on a specified date (e.g., October 17, 2020), and the price of $BTC was 11,200 on that day. Regarding the price, the remaining asset in their wallet on that day will be equal $11,200.
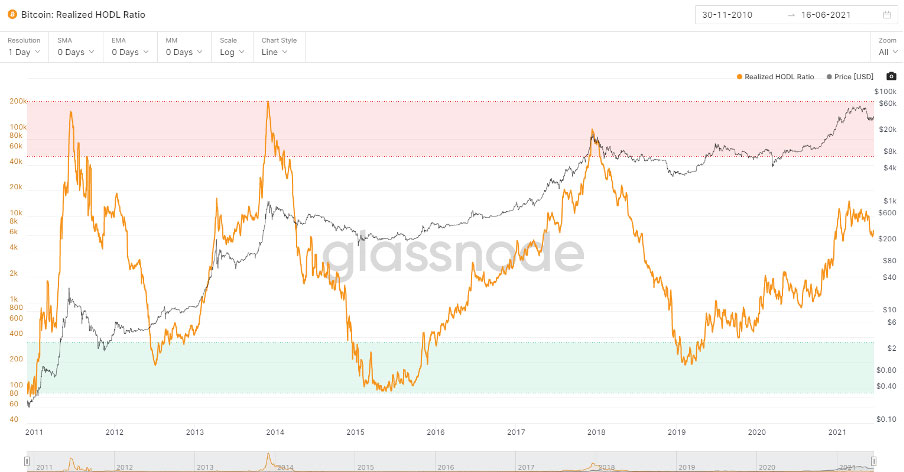
Bitcoin Realized Hold Ratio – Credit Glassnode
What are UTXOs or unspent transaction outputs?
UTXO is the unspent output from bitcoin transactions stored in a UTXO database, which is used to store change from cryptocurrency transactions.
What is the purpose of using the RHODL indicator?
By investigating the times people HOLD their bitcoins, we can realize the market’s situation, whether the price is increasing, falling, or stable. One of the purposes of using this indicator is to identify the market’s behavior and the emotional responses to the further movements to examine the upward and downward trend of bitcoin prices (price forecast).
How is the RHODL index calculated?
The formula for calculating the RHODL indicator is as follows:

To calculate the RHODL indicator comes from dividing the waves (Waves) formed in a short period (e.g., last week) by the waves formed in a more extended period (from year one to year two) and multiplying the result by the number of days since the first day of the collecting Bitcoins.
The father of this method (indicator), Philip Swift, has been collecting his data set since August 2010, besides considering the “Lindy effect,” which ensures us lost or forgotten bitcoins in this calculation included.
The Lindy effect and how it determines bitcoins lifespan?
To explain the “Lindy Effect,” it is better first to investigate the RHODL indicator waves? The waves result from oscillations of the Bitcoin price, which happen to the UTXOs in the wallets. These UTXOs are categorized based on the last time they were transferred (Age).
When these categories come to a chart, they look like waves, so market participants call them waves. Analysts use the RHODL indicator to determine whether shorter (in terms of time) waves are more or less valuable than longer waves.
The reward will continue to halve every four years until the final bitcoin has been mined. In actuality, the final bitcoin is unlikely to be mined until around the year 214.
The most significant part of the indicator we are looking for is the changes in the actual value of UTXOs. We can classify UTXOs by age, and when the data comes to a chart, the outcome will look like the following image of HODL waves(curves);
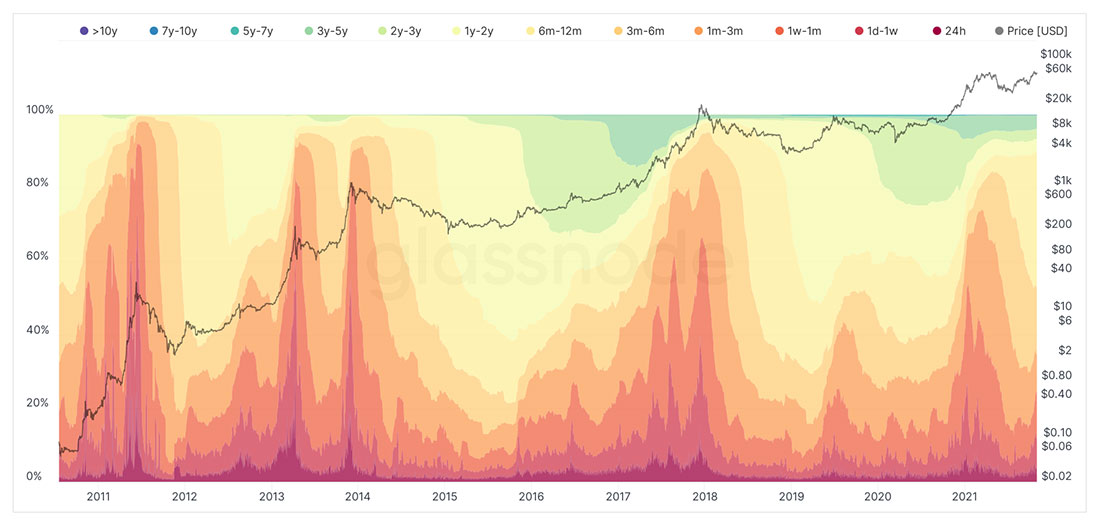
Bitcoin Realised CapHODL Waves – Credit Glassnode
The curve mentioned above shows how long bitcoins are deposited in different Bitcoin wallets and never transferred from one wallet.
An “RHODL” curve has three phases, including red, neutral, and green areas.
- The Bitcoin buying area represents that the market is stable, and it is the right time for people who want to purchase BITCOIN to buy. particularly in this curve BITCOIN, four times hit the RED Area
- The Neutral area is the surface surrounded by red and green areas. In this area, the direction of curves varies over time, sometimes toward the green surface and vice versa; please keep in mind that these movements frequently happen during the time.
- The red zone shows the insatiability of the market, and it warns that the market doesn’t follow a rational pattern and if market participants (here HOLDERS) take their profits and close their position. According to the shown information in the chart, bitcoin three times hit the red area.
What are the drawbacks of the RHODL indicator?
Bitcoin Market also has market Cycles like all other markets, and The HODL Real Value Ratio compares in one and two years terms which we consider as long-term periods. There are also short-term periods, mostly are one-week cycles. However, measuring the size of changes and the cycles in the bitcoin market might be hard to determine, which might cause this indicator to fail.
The market structure follows some patterns. For example, Market cap fluctuations change when it is most likely to decrease over time. These changes will affect the signaling ability of this indicator. Like any other indicator, it may be challenging to show an upward trend in the future if we see a long-term decline in price fluctuations and the Rounded Top pattern in bitcoin prices.
Conclusion
The RHODL indicator captures market fluctuations and the price cycle as bitcoin goes through different acceptance phases. These cycles are partly the result of bitcoin halving and accepting over time. This indicator, like other indicators, has drawbacks that it is better to pay attention to avoid fatal failures in the market.